How AI Model Monitoring Works: The Hidden Mechanics
Monitoring detects statistical drift, not logical errors, meaning a model can be statistically stable while producing harmful or incorrect outputs that bypass standard checks.

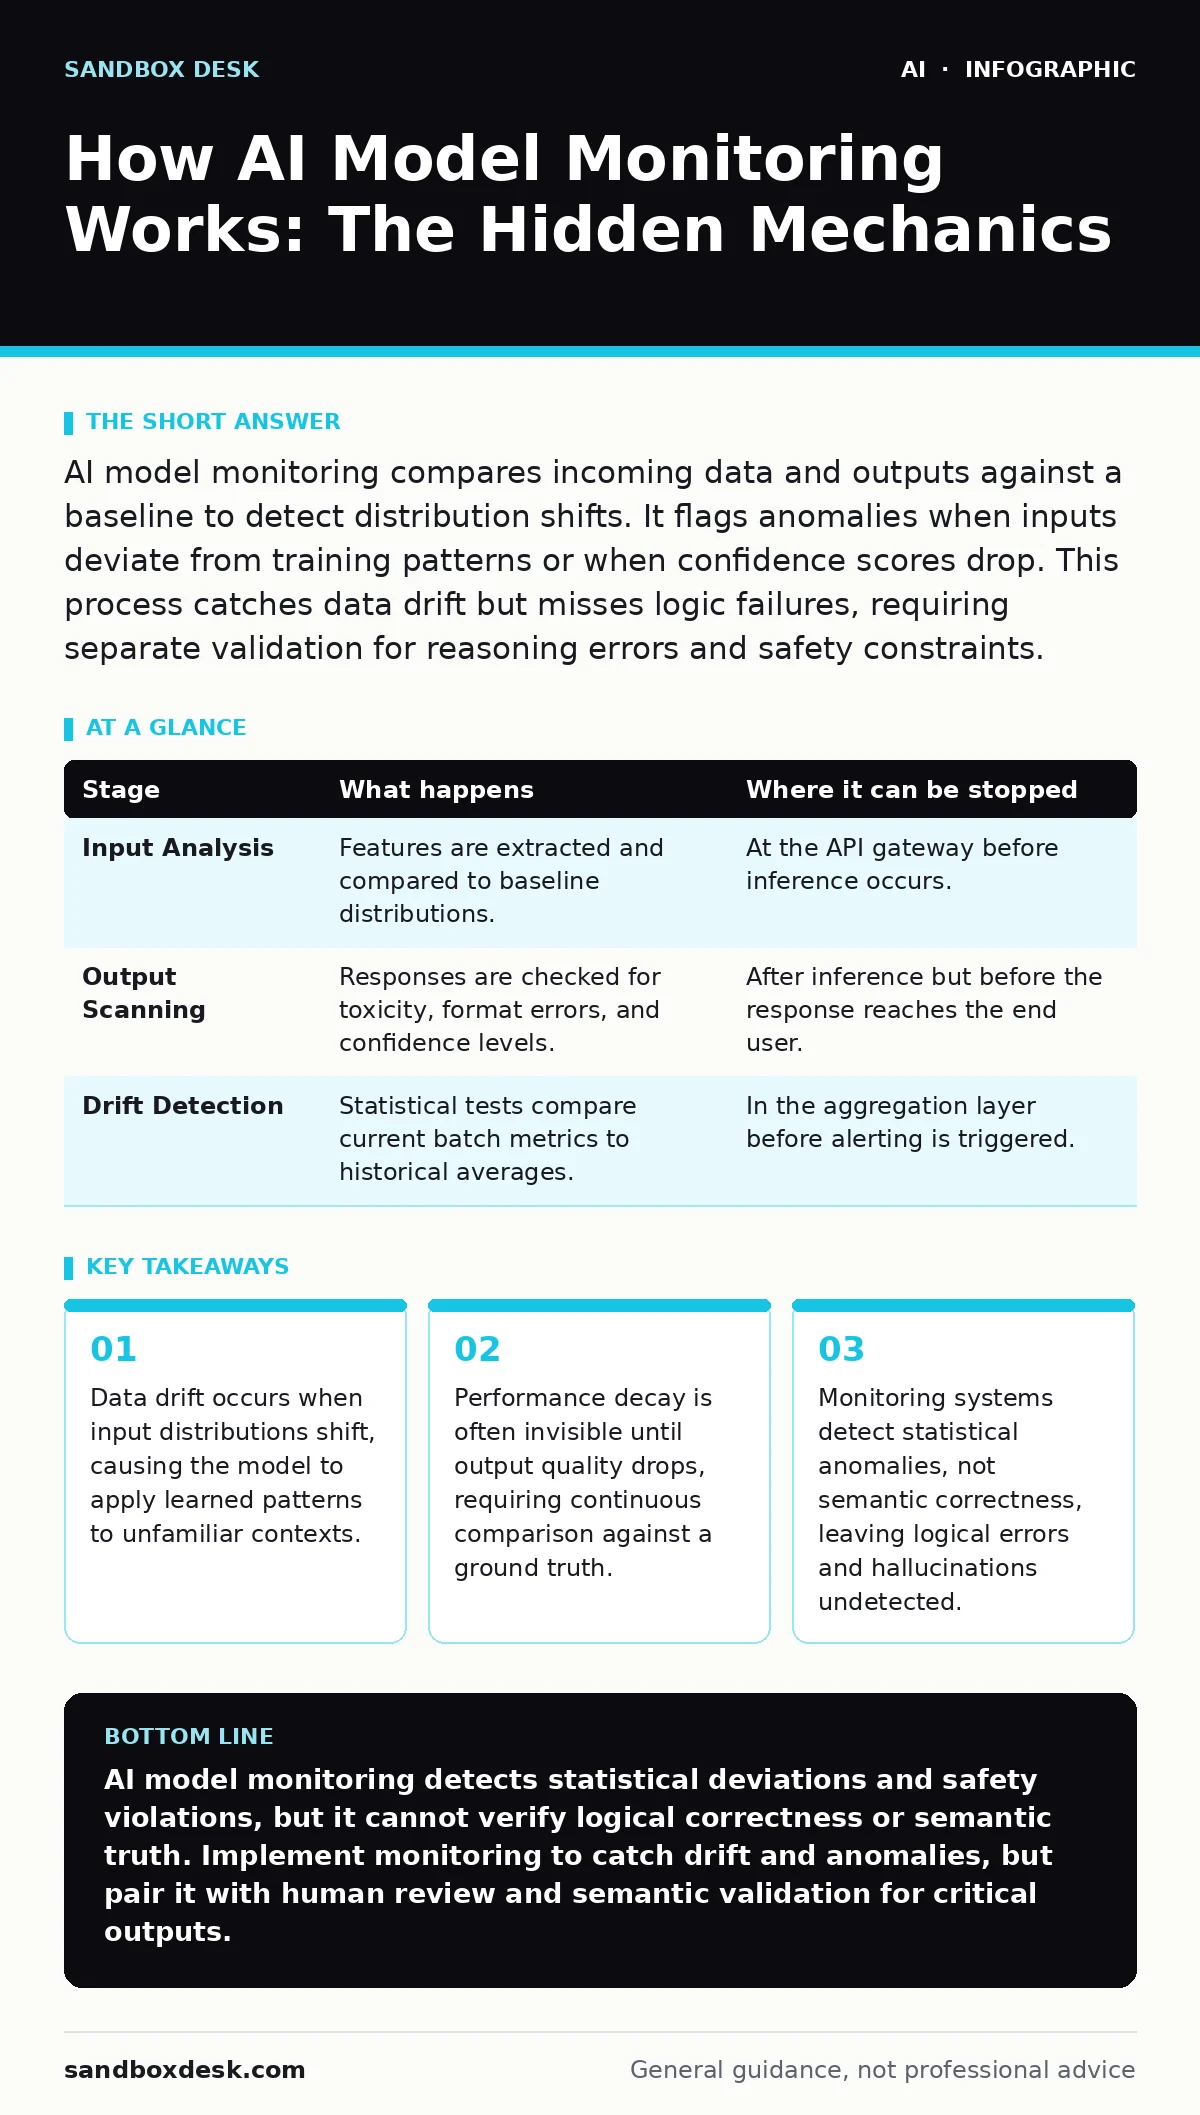
AI model monitoring compares incoming data and outputs against a baseline to detect distribution shifts. It flags anomalies when inputs deviate from training patterns or when confidence scores drop. This process catches data drift but misses logic failures, requiring separate validation for reasoning errors and safety constraints.
The Baseline Requirement
You cannot monitor what you have not defined. AI model monitoring begins with a static snapshot of the model’s behavior during a validation phase. This baseline captures the expected distribution of inputs and the corresponding distribution of outputs. It establishes the "normal" range for metrics like latency, token usage, and confidence scores.
Without this anchor, every change appears suspicious, or worse, every deviation goes unnoticed. The baseline must represent the model’s performance on representative data, not just clean, idealized examples. If the baseline is skewed, the monitoring system will treat real-world variance as an error.
This stage is often rushed. Developers deploy models and assume the initial validation covers all edge cases. It does not. The baseline is a living reference that may need updating as the model evolves through fine-tuning or as the underlying data source changes.
Stage 1: Input Ingestion and Feature Extraction
The first active step happens when a user query reaches the model. The monitoring layer intercepts the request before or alongside the inference engine. It extracts features from the raw input. For text models, this might include length, complexity, or the presence of specific token patterns. For structured data, it involves checking the distribution of numerical values.
This extraction is lightweight. It does not analyze the semantic meaning of the query. It looks for statistical properties. The system compares these properties against the baseline distribution. If the input falls outside the expected range, it is flagged as out-of-distribution.
Imagine a fraud detection model trained on domestic transactions. It receives a request with an unusual currency code and transaction size. The monitoring system sees the statistical deviation in the numerical features. It flags the input, even if the transaction is legitimate. This is a false positive, but it is a necessary cost of detecting genuine anomalies.
| Stage | What happens | Where it can be stopped |
|---|---|---|
| Input Analysis | Features are extracted and compared to baseline distributions. | At the API gateway before inference occurs. |
| Output Scanning | Responses are checked for toxicity, format errors, and confidence levels. | After inference but before the response reaches the end user. |
| Drift Detection | Statistical tests compare current batch metrics to historical averages. | In the aggregation layer before alerting is triggered. |
The Inference Blind Spot
Monitoring does not watch the model’s internal weights during inference. It observes the inputs and outputs. This creates a blind spot.
For example, a model might generate text that is grammatically perfect and statistically likely, but factually incorrect. This is known as hallucination. Standard monitoring metrics like perplexity or confidence scores often fail to detect this. The model is "confident" in its error.
This is why monitoring for large language models requires more than statistical checks. It requires semantic validation. However, semantic validation is computationally expensive and often requires human-in-the-loop review. Automated systems can only approximate this by checking against known bad patterns or using a secondary, smaller model to judge the output.
Stage 2: Output Validation and Safety Checks
Once the model generates a response, the monitoring system scans the output. It checks for predefined safety violations, such as hate speech or personally identifiable information. It also checks the format. If the model is expected to return JSON, the parser verifies the structure.
If the output fails these checks, the system can block the response. It might replace it with a safe fallback message. This is a critical control point. It prevents the immediate exposure of harmful content.
However, this stage is reactive. It catches the error after it has been generated. The computational cost of the inference has already been incurred. More importantly, it does not tell you why the model failed. It only tells you that it did. To understand the root cause, you need the next stage.
Detecting the Slow Decay
The most common failure mode is not a sudden break, but a slow decay. This is data drift. The world changes. User queries become more complex. New slang emerges. Regulatory requirements shift. The data flowing into the model gradually differs from the data it was trained on.
The model does not adapt automatically. It applies old patterns to new data. Its accuracy erodes. This erosion is often invisible to users until it becomes severe. Monitoring systems track this by comparing the current input distribution to the baseline over time.
Statistical tests, such as Kolmogorov–Smirnov or Jensen–Shannon divergence, quantify this shift. They tell you if the new data is significantly different from the old. They do not tell you if the model’s predictions are worse. They only tell you that the context has changed.
Stage 3: Aggregation and Drift Analysis
Individual requests are noisy. A single outlier is not a problem. Monitoring systems aggregate data over time windows. They calculate moving averages for key metrics. They look for trends.
If the average confidence score drops over a week, the system flags a potential performance decay. If the distribution of input lengths shifts, it flags data drift. These signals are aggregated into a dashboard or an alerting system.
This stage is where noise is filtered out. It requires careful tuning. Too sensitive, and you get alert fatigue. Too insensitive, and you miss the drift until it causes a major failure. The threshold for what constitutes "drift" is a business decision, not a technical one.
The Limits of Automated Oversight
Monitoring is not a substitute for engineering. It is a diagnostic tool. It tells you that something is wrong, not how to fix it. Fixing a drifting model often requires retraining. This introduces AI supply chain risks if the new training data is not carefully curated.
Monitoring also cannot detect bias that is inherent in the model’s weights. If the model was trained on biased data, it will produce biased outputs. Monitoring can flag disproportionate outcomes, but it cannot determine if the bias is fair or unfair without human context.
Furthermore, monitoring adds latency. Every check takes time. In high-throughput systems, this latency can be unacceptable. You must balance the depth of monitoring with the speed of the response.
See also: Difference Between Fine Tuning and Transfer Learning for Models · How Large Language Models Work: Mechanics, Limits, and Reality
Integrating with Risk Frameworks
Effective monitoring is part of a broader AI risk management strategy. It provides the data needed to assess risk. It feeds into incident response plans. It helps you understand the model’s limitations.
You should integrate monitoring logs with other security tools. Look for correlations between model performance and security events. For instance, a spike in hallucinations might coincide with a training data leakage event.
Remember that monitoring is a continuous process. It does not end at deployment. It ends when the model is retired. Until then, it requires constant attention and adjustment.
Key takeaways
- Data drift occurs when input distributions shift, causing the model to apply learned patterns to unfamiliar contexts.
- Performance decay is often invisible until output quality drops, requiring continuous comparison against a ground truth.
- Monitoring systems detect statistical anomalies, not semantic correctness, leaving logical errors and hallucinations undetected.
AI model monitoring detects statistical deviations and safety violations, but it cannot verify logical correctness or semantic truth. Implement monitoring to catch drift and anomalies, but pair it with human review and semantic validation for critical outputs.
Frequently asked questions
Does monitoring prevent data poisoning attacks?
No, monitoring detects the effects of poisoned data, such as unusual output patterns or performance drops. It does not prevent the initial poisoning of the training set, which is a training data leakage risk.
How quickly can monitoring detect a model failure?
Detection speed depends on the aggregation window. Real-time monitoring can flag individual anomalous requests instantly. Drift detection, which relies on statistical trends, may take hours or days to confirm a significant shift.
Can monitoring fix a drifting model?
No, monitoring only alerts you to the drift. Fixing it requires human intervention, such as retraining the model with new data, adjusting the model’s weights, or updating the input preprocessing pipeline.
Is monitoring enough for regulatory compliance?
Monitoring provides evidence of oversight, which is often required for compliance. However, regulations usually demand more than just technical monitoring, including documentation of risk assessments and human accountability processes.
How this guide was produced: written by the Sandbox Desk editorial team with AI assistance, checked against the public references listed below, and reviewed when the facts change. See our editorial policy or report an error.